
A framework for imaging studies that follow glycan synthesis in living cells over time. It separates the biosynthetic question, the labeling chemistry, the acquisition setup, the kinetic analysis, and the functional readout that gives the measurements meaning.
Quick facts
- DomainLife Sciences
- Layers5
- Reading order5 steps
- Sources4 listed
Layer structure
- 01Biosynthetic Question
Identifies which glycosylation step is under study and what a change in its rate would imply for cell behavior or surface recognition.
- 02Metabolic Labeling
Defines probe chemistry, incorporation window, and controls, since labeling strategy determines whether signal reflects synthesis or accumulated abundance.
- 03Live Imaging Acquisition
Sets microscope configuration, temporal resolution, phototoxicity limits, and the tracking approach used for moving or dividing cells.
- 04Kinetic Signal Analysis
Specifies background correction, colocalization criteria, and the kinetic model that converts intensity into a synthesis rate with units.
- 05Glycan Function Readout
Connects measured dynamics to adhesion, signaling, or trafficking assays so the observation is tied to a biological role rather than brightness.
How to read this roadmap
Open with the biosynthetic question to establish which step matters and what a change in its rate would mean.
Read the labeling layer carefully, because probe choice limits whether signal reports synthesis, turnover, or bulk abundance.
Continue into acquisition, where temporal resolution and phototoxicity constraints define the useful observation window.
Move to analysis, which should show how raw intensity becomes a rate and which controls are subtracted along the way.
Close with the functional readout that links the measured dynamics to a cellular behavior reviewers will recognize.
Design logic behind the structure
Probe limits meaning
Labeling chemistry is drawn early because it determines whether the recorded signal can be read as synthesis rather than steady-state abundance.
Acquisition constraints visible
Phototoxicity and temporal resolution are treated as design boundaries, not technical notes, since they cap what dynamics can be resolved.
Rate, not intensity
The analysis layer converts fluorescence into a kinetic parameter so comparisons rest on a quantity with units rather than arbitrary brightness.
Function closes the loop
A functional assay sits at the end so structural dynamics are connected to a phenotype rather than left as an imaging observation.
Adapting this structure to your own project
- Replace the glycosylation step with your own pathway and keep the question-to-readout spine.
- Document probe concentration, pulse duration, and washing controls inside the labeling layer.
- Add a photobleaching control box to acquisition if your time series runs longer than a few hours.
- State the kinetic model and its assumptions explicitly in the analysis layer.
- Choose one functional assay that runs in the same cell line to strengthen the link between dynamics and behavior.
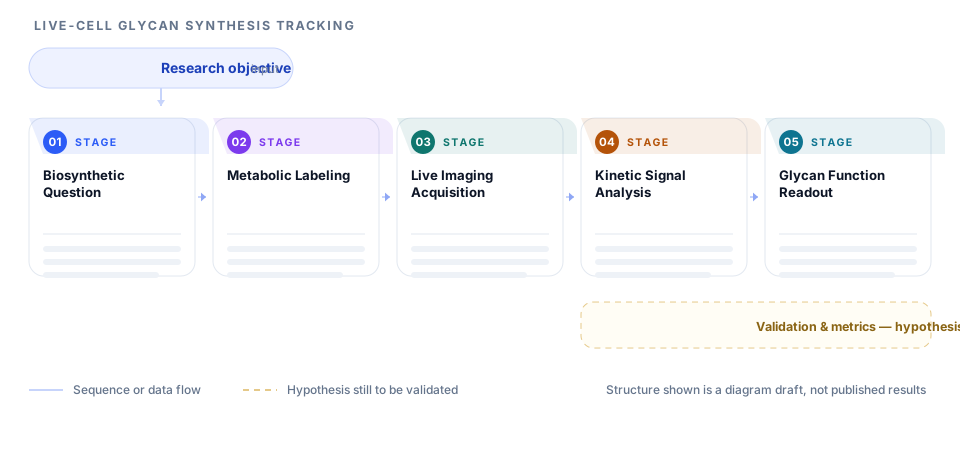
This page illustrates intended research design. It is not evidence that any result has been achieved.
When this structure fits - and when it does not
A good fit when
- Live-cell imaging studies of glycosylation, trafficking, or membrane turnover.
- Projects that need to distinguish synthesis rate from steady-state abundance.
- Proposals where phototoxicity and temporal resolution must be justified explicitly.
Not a fit when
- Fixed-cell endpoint studies with no time dimension.
- Structural glycan chemistry with no live imaging component.
- Screens where the readout is a single population average with no kinetic information.
Frequently asked questions
Does the roadmap predict what the imaging will show?
No. It lays out how the study would be structured to measure glycan dynamics and connect them to function. The observations themselves are what the experiment is designed to produce.
Why is the labeling layer so prominent?
Because the probe determines the interpretation. A short metabolic pulse reports synthesis, while a long incubation can report accumulated abundance, and those support different claims.
How do I handle phototoxicity?
Treat it as a design constraint in the acquisition layer. State the light dose, the interval, and the control used to show cells remain healthy across the imaging window.
Can I use this structure for a methods paper?
Yes, though you would expand the labeling and acquisition layers and shorten the functional readout, since a methods paper is judged largely on reproducibility.
Sources and further reading
- ORCID - persistent identifiers for researchersORCID
- JATS - Journal Article Tag Suite, the standard article structureNational Center for Biotechnology Information, U.S. National Library of Medicine
- EQUATOR Network - library of reporting guidelinesUK EQUATOR Centre, University of Oxford
- STROBE - reporting guidance for observational studiesSTROBE Initiative
These are the organisations whose published guidance the recommendations on this page follow. Listing them does not imply that they endorse Pathform AI, and this page is not affiliated with them.