
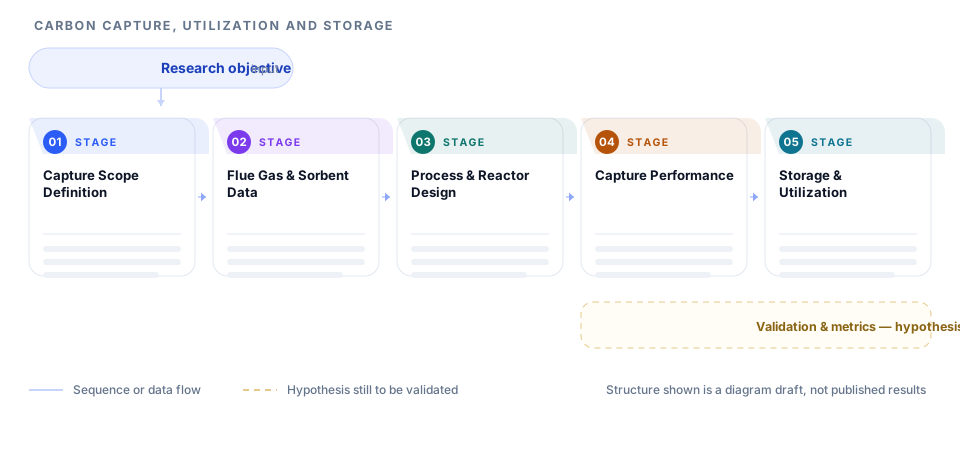
This page illustrates intended research design. It is not evidence that any result has been achieved.
A structure for CCUS research that spans capture chemistry, process engineering, and storage. It separates the emissions source, the feed and material data, the separation process, the performance metrics, and the utilization or storage pathway.
Layer structure
How to read this roadmap
- Start with the emission source and capture boundary, because a target defined against real flue gas differs from one defined in a laboratory.
- Read the feed and material layer to see which contaminants and material limits will govern performance.
- Move to process design, where contactor and regeneration choices set the energy penalty the rest of the study must live with.
- Follow into performance metrics, checking that cyclic stability and parasitic load are reported rather than single-pass capacity alone.
- Finish at storage or utilization, which determines whether captured carbon has a credible destination.
Design logic behind the structure
Boundary first
The system boundary is drawn before any material selection because capture rate and purity targets only mean something relative to a defined source.
Real gas composition
Trace contaminants such as sulfur and oxygen species get their own box because they drive degradation more than bulk composition does.
Energy penalty explicit
Regeneration heat and parasitic load appear as measured outputs so improvements across materials can be compared on a consistent basis.
Destination required
Storage or utilization sits inside the design rather than after it, because a capture route without a destination is not a complete system.
Adapting this structure to your own project
- Set your own emission source and purity target in the first layer and keep the process spine intact.
- List trace contaminants in your gas stream and add a degradation test to the performance layer.
- Add a techno-economic box beside the performance metrics if your proposal carries a cost aim.
- Adjust the storage layer for mineralization, saline aquifer, or enhanced recovery depending on your region.
- Use the boundary layer to state what your study excludes, which reviewers frequently ask about.
When this structure fits - and when it does not
A good fit when
- Capture material and process studies evaluated on realistic gas streams.
- Integrated assessments that connect capture performance to a storage or utilization route.
- Proposals that must report an energy penalty alongside capacity.
Not a fit when
- Pure material synthesis with no process or systems context.
- Policy analyses that contain no technical capture component.
- Benchmark studies that report only single-cycle capacity.
Related reading
- Technical Roadmap Pack
- Research Architecture Pack
Frequently asked questions
Does the diagram claim a capture technology will meet a target?
No. It maps how the research would be designed to characterize a material or process and compare it against a defined boundary. Performance numbers come from experiments, not from the diagram.
Why include utilization and storage in a capture study?
Because capture without a destination does not reduce net emissions. Including the pathway forces the design to state where the carbon goes and what purity or pressure that requires.
How should trace contaminants be handled?
Give them explicit boxes in the feed layer and a degradation test in the performance layer. Real flue gas contains species that shorten sorbent life, and reviewers expect that risk to be addressed.
Can the framework be used for direct air capture?
The same five layers apply, though the feed layer changes to ambient conditions and the performance layer should report the very low CO2 partial pressure explicitly.
Sources and further reading
- ORCID - persistent identifiers for researchersORCID
- JATS - Journal Article Tag Suite, the standard article structureNational Center for Biotechnology Information, U.S. National Library of Medicine
- EQUATOR Network - library of reporting guidelinesUK EQUATOR Centre, University of Oxford
- STROBE - reporting guidance for observational studiesSTROBE Initiative
These are the organisations whose published guidance the recommendations on this page follow. Listing them does not imply that they endorse Pathform AI, and this page is not affiliated with them.