
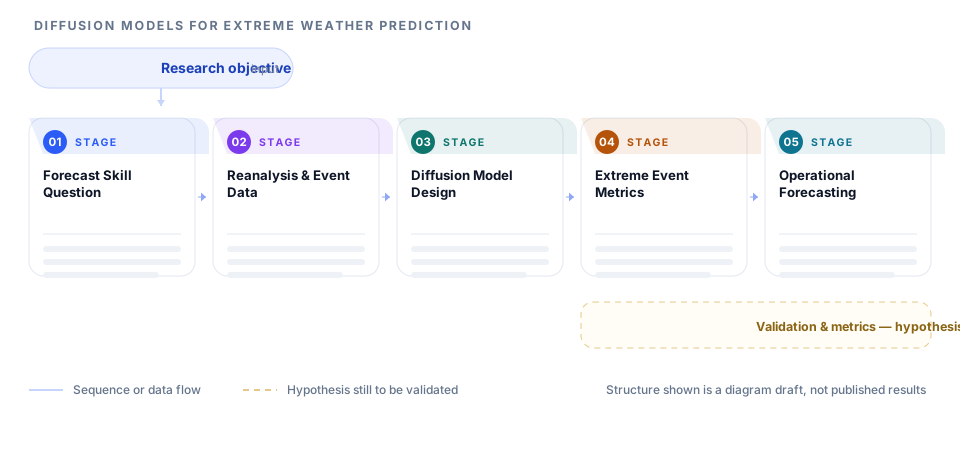
This page illustrates intended research design. It is not evidence that any result has been achieved.
A roadmap for research applying diffusion models to extreme weather forecasting. It separates the forecast skill question, the reanalysis and event data, the generative model design, the extreme event metrics, and the operational use case.
Layer structure
How to read this roadmap
Open with the extreme event and lead time, because skill requirements differ sharply between a heatwave and a convective storm.
Read the data layer to see which archive and event inventory define the training distribution.
Move to the model layer, where conditioning inputs and noise schedule set what the generative process can represent.
Follow the metrics layer, checking that tail behavior is evaluated rather than only mean error.
Finish at operations, which shows how the model would be compared against an existing forecast system.
Design logic behind the structure
Event defines skill
The extreme event and lead time are named first so performance is judged on the case the research cares about rather than on average accuracy.
Tails need own metrics
Evaluation is designed around distribution tails, because low mean error can coexist with poor representation of extremes.
Conditioning made explicit
The inputs that steer generation are listed as deliberate design choices so the model is not treated as an unsupervised black box.
Baseline required
An operational reference forecast is part of the design, which is the only way a skill claim becomes interpretable to reviewers.
Adapting this structure to your own project
- Name your extreme event, region, and lead time before choosing a model backbone.
- Record how your training archive is normalized so results can be reproduced by others.
- State the conditioning variables and their sources explicitly in the model layer.
- Add quantile or threshold-based metrics alongside mean error in the evaluation layer.
- Include a cost estimate in the operational layer if your proposal promises real-time use.
When this structure fits - and when it does not
A good fit when
- Generative modeling studies focused on extreme event forecasting.
- Proposals comparing a learned forecast system against an operational baseline.
- Work that requires probabilistic evaluation of distribution tails.
Not a fit when
- Model development with no meteorological evaluation plan.
- Long-term climate projection studies at decadal rather than synoptic scales.
- Downscaling work where the target variable is not an extreme event.
Frequently asked questions
Does the roadmap show that diffusion models outperform existing forecasts?
No. It lays out how such a comparison would be designed, including the baseline, the metrics, and the event set. Whether the model improves skill is the question the study is built to answer.
Why evaluate tails separately?
Because a model can post low average error while smoothing the extremes forecasters care about most. Threshold and quantile metrics make that failure mode visible.
How much compute should be budgeted?
Enough that the method is compared fairly. State training cost, ensemble size, and inference time, since a forecast that cannot run inside an operational window has limited use.
Can the framework be used for non-weather diffusion models?
The layers transfer to other spatiotemporal generation tasks, but the data layer must be rebuilt around the appropriate archive and the metrics around the relevant extremes.
Sources and further reading
- EQUATOR Network - library of reporting guidelinesUK EQUATOR Centre, University of Oxford
- STROBE - reporting guidance for observational studiesSTROBE Initiative
- ARRIVE - reporting guidance for animal researchARRIVE Guidelines
- CONSORT - reporting guidance for randomised trialsCONSORT Group
These are the organisations whose published guidance the recommendations on this page follow. Listing them does not imply that they endorse Pathform AI, and this page is not affiliated with them.