
A design for silicon solar cell research that connects a device-level efficiency gap to measurable loss mechanisms. It separates the efficiency question, the wafer and interface data, the device stack, the loss analysis, and the path to module scale.
Quick facts
- DomainMaterials Science
- Layers5
- Reading order5 steps
- Sources4 listed
Layer structure
- 01Efficiency Limit Question
States how far the device sits from its practical limit and which loss channel the study intends to address first.
- 02Wafer & Interface Data
Characterizes bulk lifetime, doping, and surface passivation quality, since these set the ceiling on achievable open-circuit voltage.
- 03Device Stack Design
Defines emitter, contact scheme, and passivation layers along with the processing steps and the thermal budget they require.
- 04Loss & Characterization
Separates optical, recombination, and resistive losses using measured data and states which technique supports each attribution.
- 05Module Scale-Up
Covers encapsulation, interconnection, and degradation testing, which is where cell-level gains are most often partially lost.
How to read this roadmap
Start with the efficiency gap and name the dominant loss channel, because that choice drives every decision below it.
Read the wafer and interface layer to see whether bulk and surface quality leave room for the improvement being proposed.
Move into device design, where the stack and thermal budget determine which losses are actually addressable.
Follow the characterization layer to check that each loss attribution rests on a measurement rather than an estimate.
Finish at module scale-up, which shows what survives encapsulation and field exposure.
Design logic behind the structure
Loss channel prioritized
Naming the dominant loss first prevents the study from changing several parameters at once and crediting the wrong cause.
Material ceiling stated
Bulk lifetime and passivation quality appear before device design, because they cap what any stack change can achieve.
One technique per loss
Each loss category is tied to a specific measurement so the attribution can be checked independently by another group.
Scale-up inside the plan
Module processing is drawn as part of the design, since cell efficiency gains do not automatically survive interconnection and encapsulation.
Adapting this structure to your own project
- Pick your own dominant loss channel and keep the measurement-to-attribution structure.
- Report wafer and passivation baselines before proposing any stack change.
- Add a thermal budget row to the device layer if your process has temperature-sensitive steps.
- Use the loss layer to state which technique supports each claim in your results section.
- Include at least one degradation test in the scale-up layer for grant proposals.
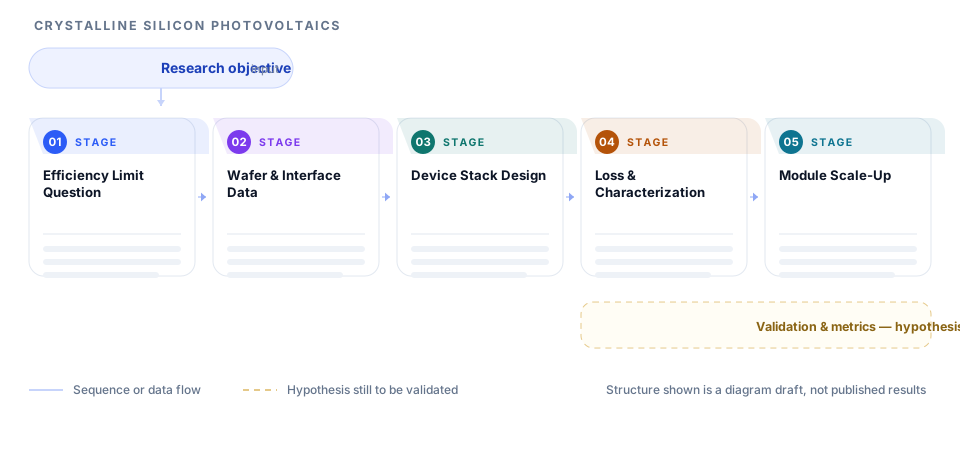
This page illustrates intended research design. It is not evidence that any result has been achieved.
When this structure fits - and when it does not
A good fit when
- Cell-level studies targeting a specific efficiency or voltage loss.
- Proposals that connect material quality to device performance.
- Work where module-level reliability must be addressed early in the plan.
Not a fit when
- Pure material synthesis with no device fabrication step.
- System-level studies of installation and grid integration.
- Simulation-only work with no characterization plan.
Frequently asked questions
Does the roadmap promise an efficiency gain?
No. It shows how a study would be designed to identify and reduce a specific loss channel. Whether the gain is achieved depends on fabrication and measurement, which the diagram does not predict.
Why include module scale-up in a cell study?
Because encapsulation and interconnection frequently consume part of a cell-level gain. Including them signals that the research plan accounts for realistic manufacturing conditions.
How should losses be attributed?
One technique per loss category. Optical, recombination, and resistive losses each need a measurement that can distinguish them, otherwise the attribution is an assumption rather than a result.
Can this structure be used for tandem cells?
The five layers hold, but the interface layer must expand to cover the tunnel junction or recombination contact, which is usually where tandem losses concentrate.
Sources and further reading
- ORCID - persistent identifiers for researchersORCID
- JATS - Journal Article Tag Suite, the standard article structureNational Center for Biotechnology Information, U.S. National Library of Medicine
- EQUATOR Network - library of reporting guidelinesUK EQUATOR Centre, University of Oxford
- STROBE - reporting guidance for observational studiesSTROBE Initiative
These are the organisations whose published guidance the recommendations on this page follow. Listing them does not imply that they endorse Pathform AI, and this page is not affiliated with them.